7. Data Science Workflow#
Data science can often feel like piecing together a jigsaw puzzle. But like any puzzle, there’s a method to the madness, a sequence that can make the process smoother. That’s where the idea of a data science workflow comes in. In our previous chapter, we used the analogies of detective work and the scientific method to explain data science. Similarly, every detective has a method to their investigation, and every scientist follows a systematic process in their research.
In data science, it’s paramount to have a blueprint, a sequence of steps, that can guide the project from inception to completion. This blueprint is called a data science workflow. It serves as a roadmap that provides clarity on the stages involved in a data science project. Just as a detective might start with gathering evidence, then move on to interviewing witnesses, and finally piece together the entire story, a data scientist moves through distinct phases to derive insights from data.
While the last chapter hinted that there’s no universally accepted data science workflow, several models and frameworks have been proposed over the years [Weihs and Ickstadt, 2018][Donoho, 2017]. Each of these frameworks is tailored to different needs and contexts, and their structure and emphasis can vary significantly. For instance:
Circular workflows, most commonly CRISP-DM [Wirth and Hipp, 2000][Weihs and Ickstadt, 2018] usually emphasize deployment. They often stem from an industry or software development background where iterative development and frequent updates are the norm. These workflows recognize that the end of one project cycle can be the beginning of another, especially as new data comes in or as models need refining.
Linear workflows, like OSEMN (Obtain, Scrub, Explore, Model, and iNterpret), tend to have a start and end. However, it’s essential to understand that even in these linear models, iterations within steps are common [Mason and Wiggins, 2010].
There are also tree-like workflows, where after a certain step, the process might branch out into multiple paths, reflecting the multifaceted nature of some data science projects [Guo, 2022].
In this book, we’ll be introducing our tailored workflow called ASEMIC (Fig. 7.1). Inspired by OSEMN, this framework is designed to capture the essence of a typical data science project while allowing for flexibility. Important to note is that the data science typically is linked to overarching questions or tasks. Those will largely determine the many decisions we have to take in every phase of our workflow. The ASEMIC model comprises:
Acquire data: This is where we obtain our raw data, the foundation of our entire project.
Scrub data: Data is rarely perfect. In this phase, we clean our data by handling missing values, outliers, and errors.
Explore data: Through visualization and statistical analysis, we delve deep into our data to understand its nuances.
Model data: Based on our understanding, we choose suitable algorithms and techniques to model our data.
Interpret results: Once we have our model results, we decipher what they mean in the context of our problem.
Communicate results: Data science is as much about communication as computation. Here, we present our findings in a clear, compelling manner.
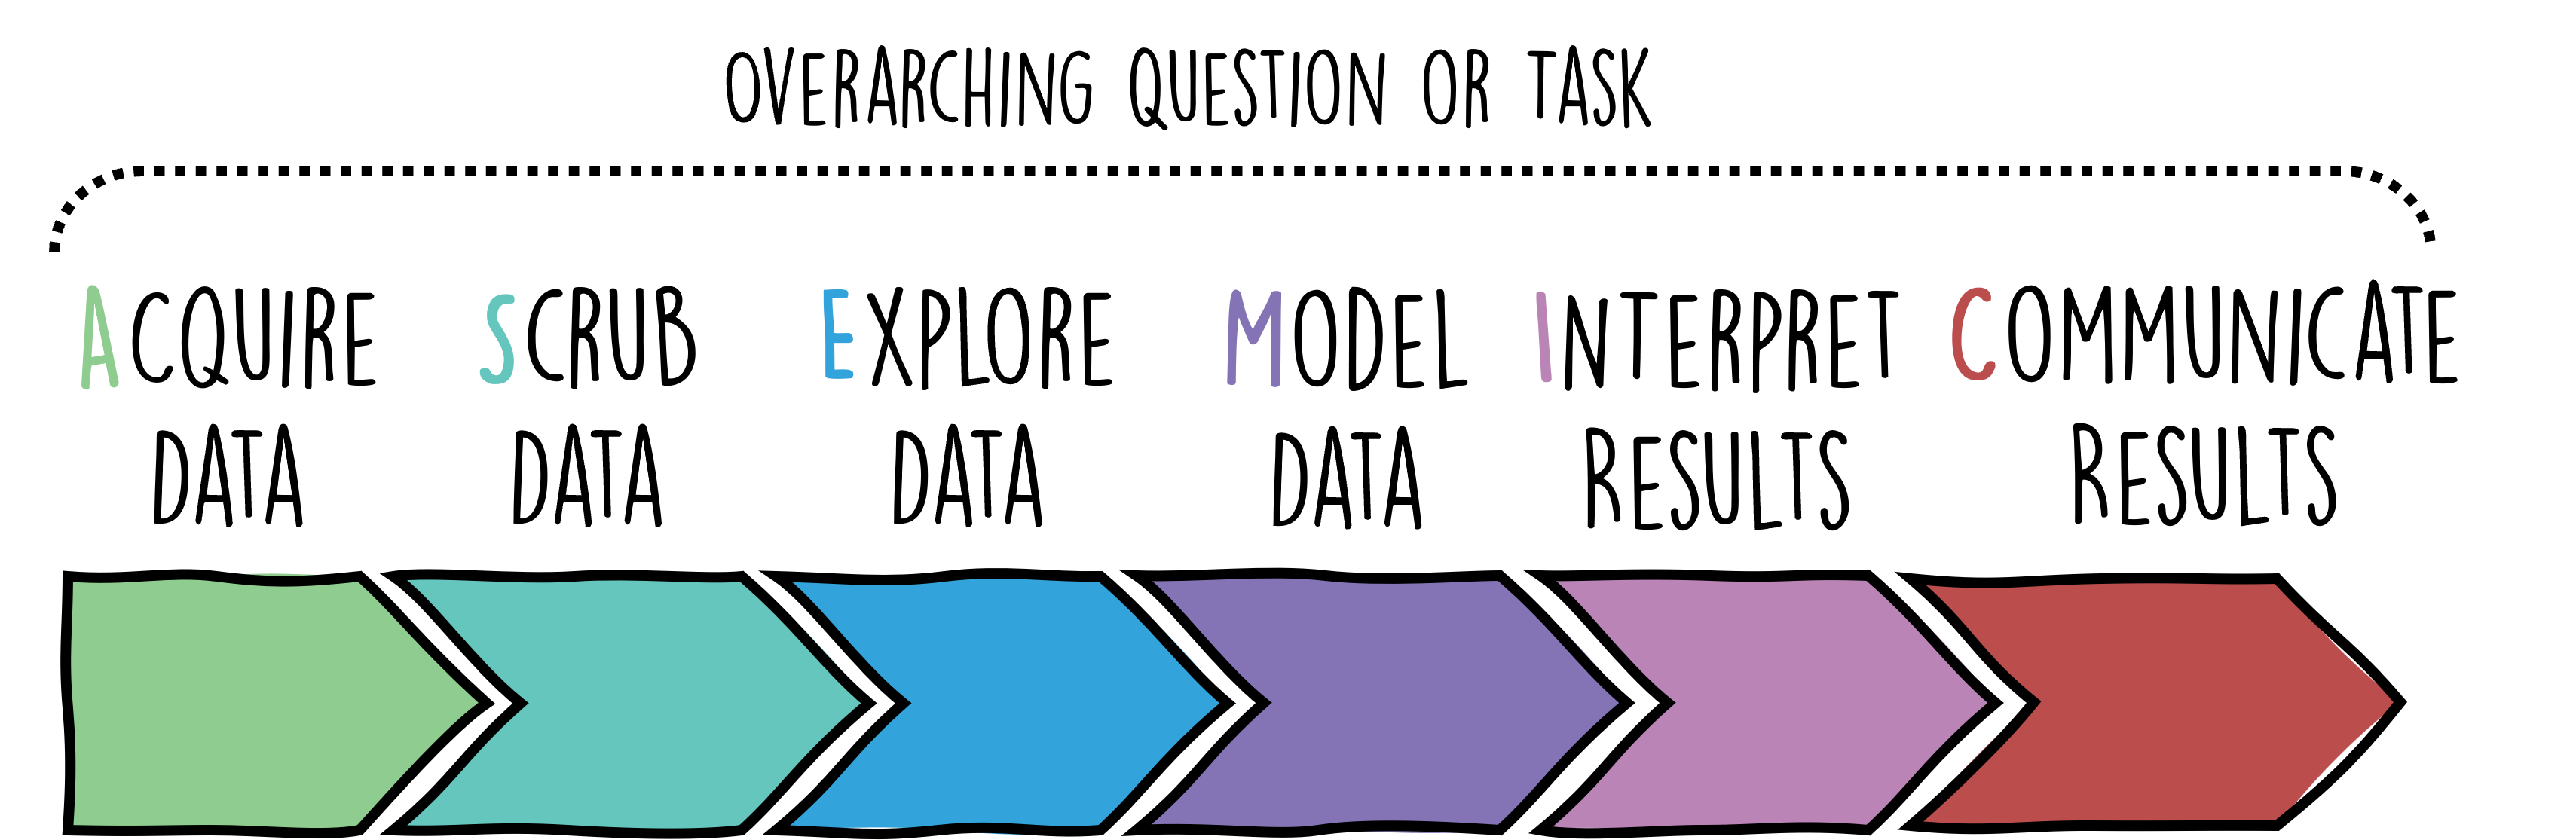
Fig. 7.1 Simplified sketch of an ASEMIC data science workflow.#
It’s crucial to note that real-world data science is rarely a linear progression from one step to the next. It’s an iterative process, filled with cycles (Fig. 7.2). After modeling, you might find that you need to go back to the data scrubbing phase, or after interpreting results, you might need to revisit the exploration phase. This non-linear, cyclical nature of data science is what makes it both challenging and fascinating.
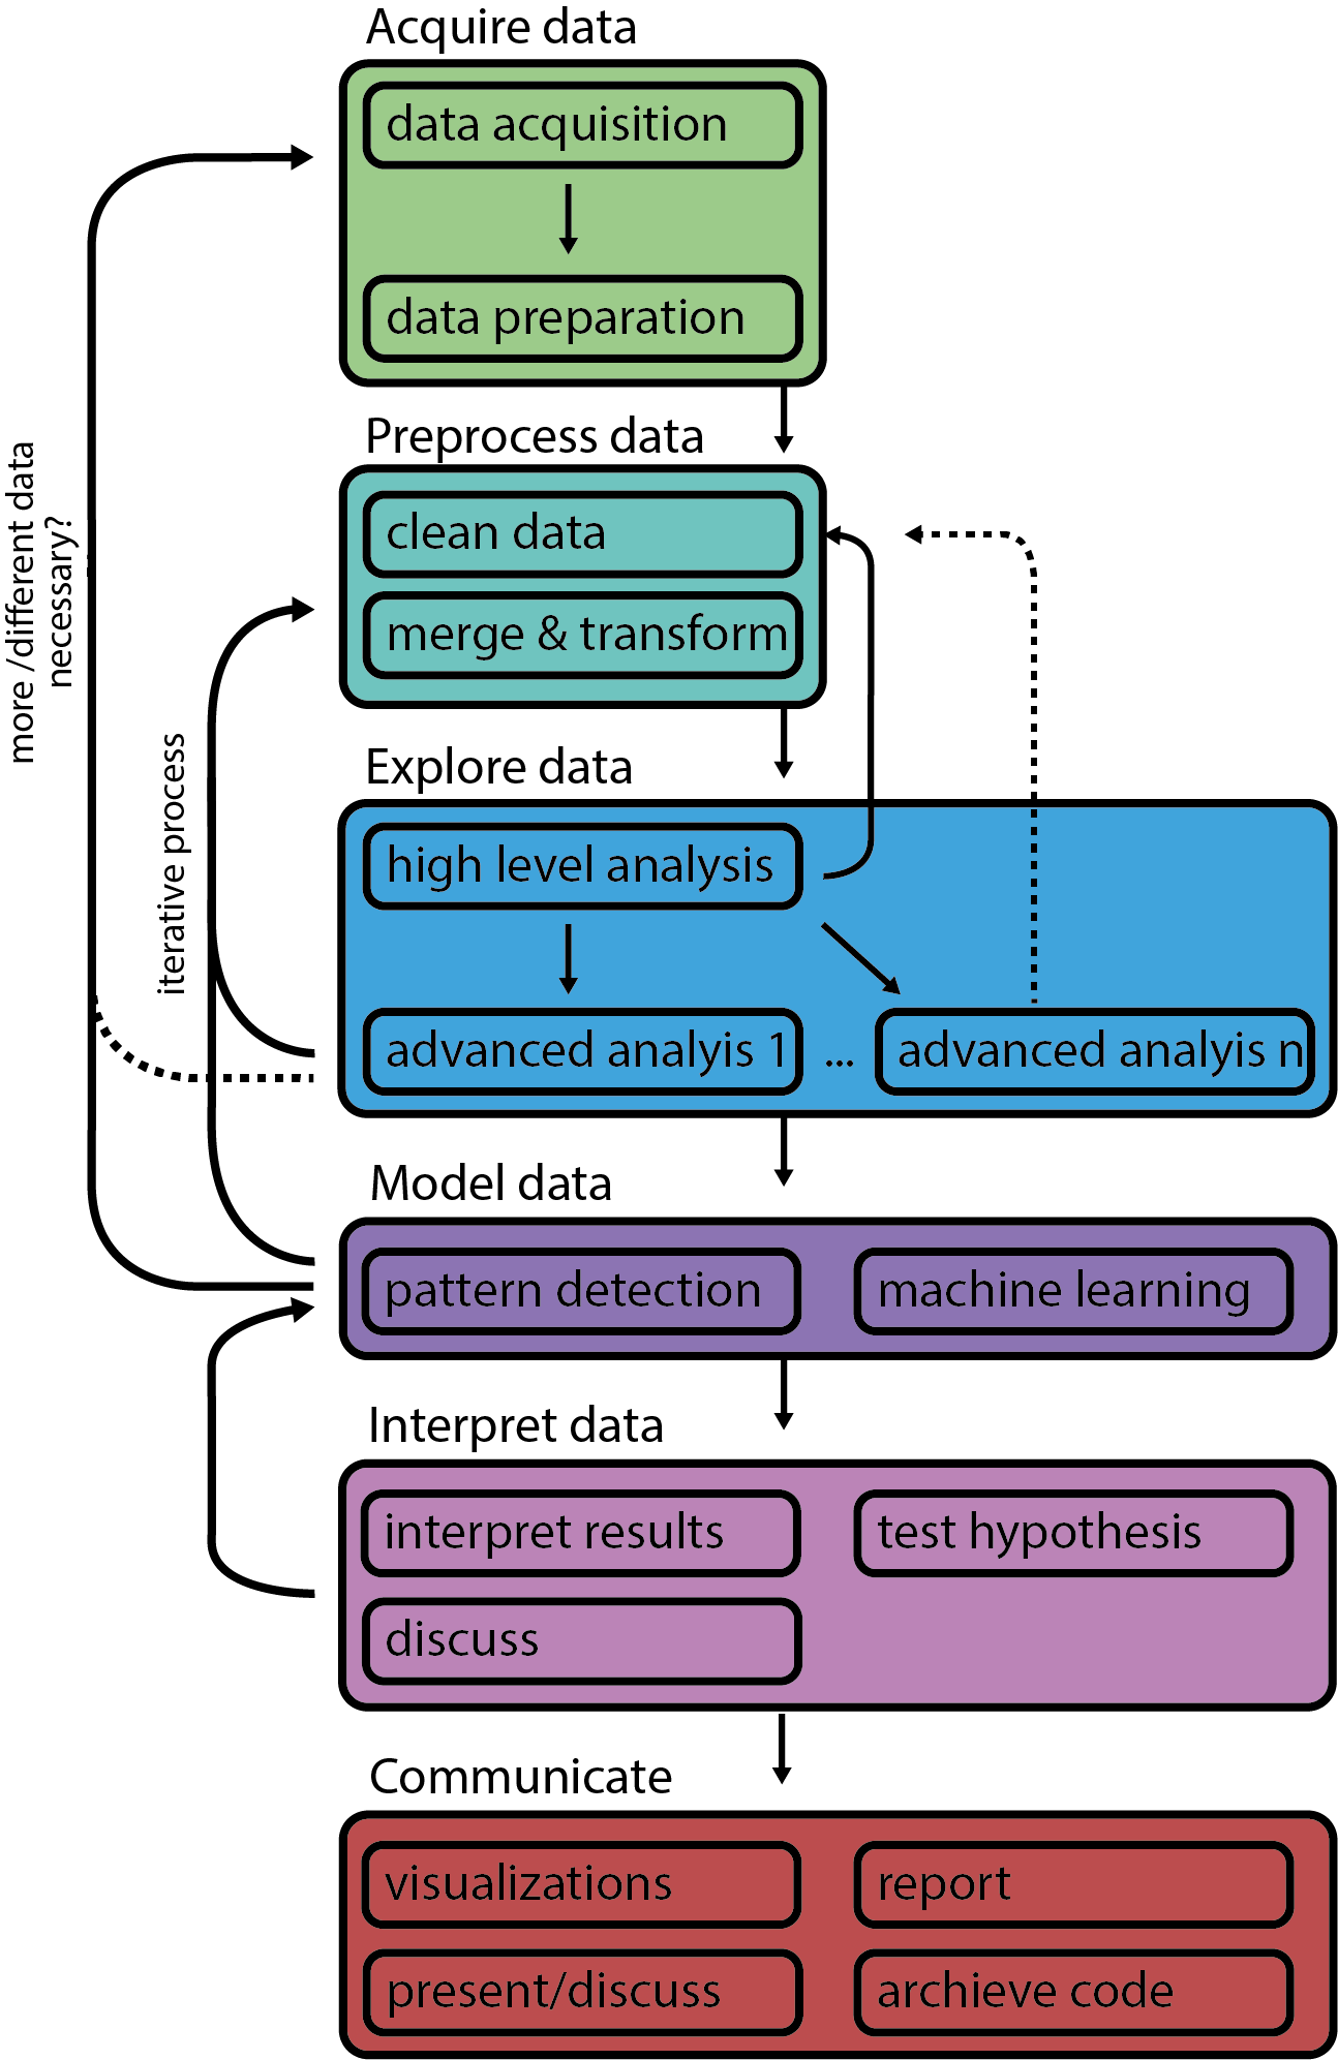
Fig. 7.2 More detailed sketch of the ASEMIC data science workflow, highlighting the interconnected nature of the different steps or phases.#
Drawing parallels with the detective analogy: imagine a detective who, after gathering all evidence (Acquire), ensures they’re all pertinent and discards the irrelevant ones (Scrub). They then analyze the evidence, looking for patterns or connections (Explore), formulate a theory about the crime (Model), assess how well this theory fits with the facts (Interpret), and finally present their findings to their team or in court (Communicate). Just as a detective might revisit a crime scene or re-interview a witness based on new findings, a data scientist might loop back to earlier steps based on new insights or challenges.
In practice, each data science workflow is different an having a sketch (such as ASEMIC) in mind is mostly meant for general orientation across the many different phases of such a project. But what can already be seen from such descriptions is that a data science process consists of a wide variety of different phases or steps, which ultimately also leads to the wide variety of techniques and tools that need to be used throughout such a process. The present book will aim to give a broad, general overview but obviously cannot go into full depth on most of the introduced topics. Throughout the following sections, you will hopefully gain a better understanding of what the different phases comprise and what skills and expertise they require.
Speaking of expertise, let’s rephrase something from Section 2.2 . It is very common in data science projects that they cannot be carried out by one person alone! If you were hoping to work all day on your own in front of a computer… better reconsider the idea of becoming a data scientist. In most cases, you will need to team up with people who bring in other skills and expertise and communicate the targets and results with people from very different backgrounds. In Fig. 7.3 I tried to illustrate that this often leads to very dynamic processes with strongly varying requirements for different phases or time points.
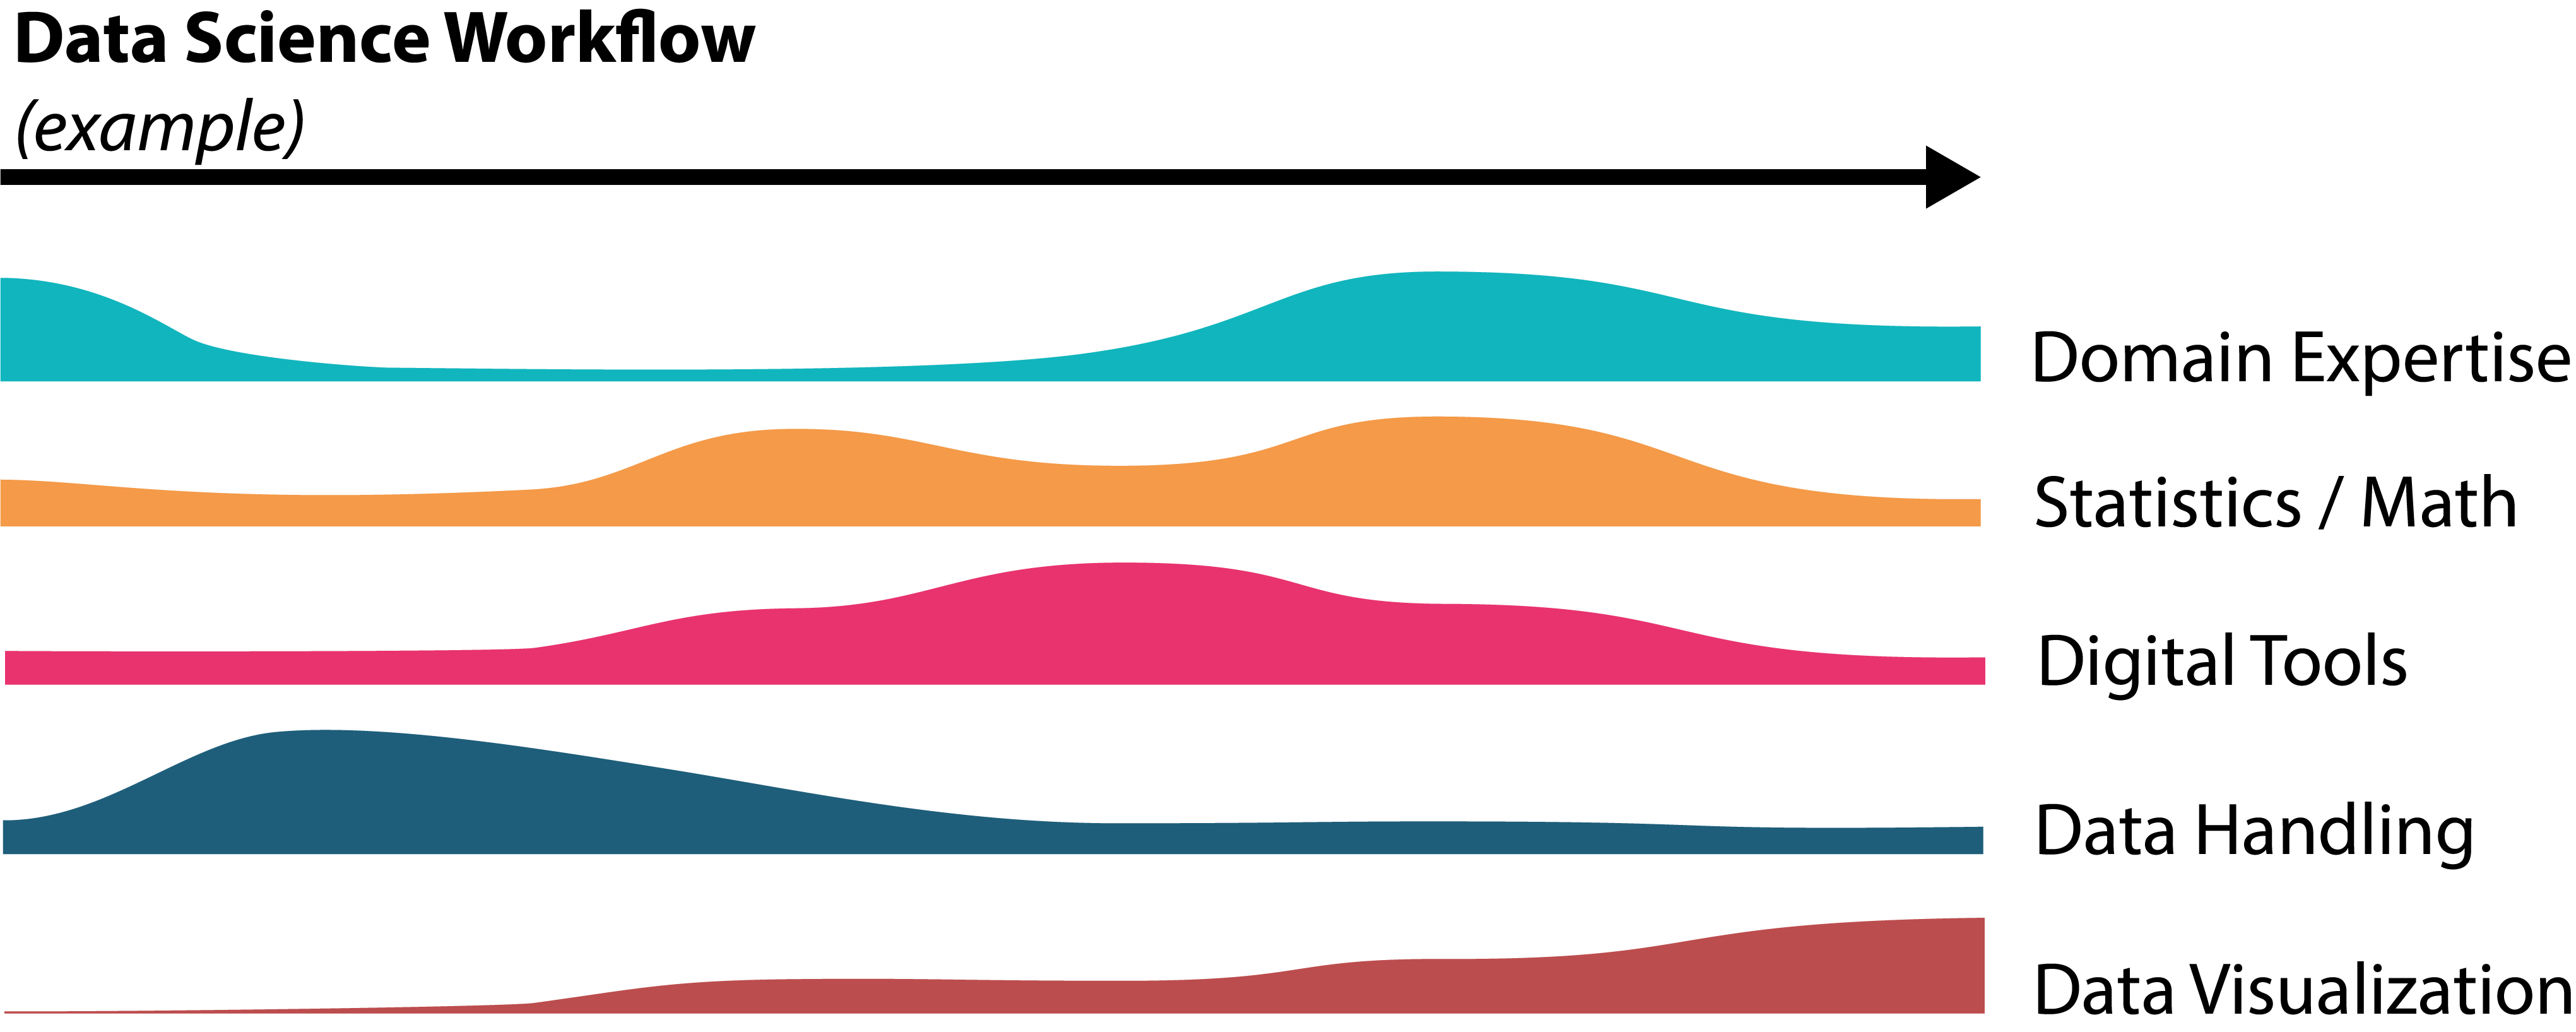
Fig. 7.3 Sketch of an example data science process to illustrate that different skills and expertise is required for different phases of a typical data science project.#
In the following sections, we’ll use the ASEMIC workflow to navigate through a large variety of data science techniques, from data handling to analysis, interpretation, and visualization.